
Compared to fMRI, fNIRS has advantages and disadvantages. While fMRI has become the gold standard for in vivo imaging of the human brain, fNIRS stands out for its portability and robustness to noise, bringing functional imaging into much more realistic environments. While limited by its inferior spatial resolution and penetration depth, fNIRS has a much higher temporal resolution than fMRI, allowing measurements of concentration changes in both oxygenated and deoxygenated hemoglobin.


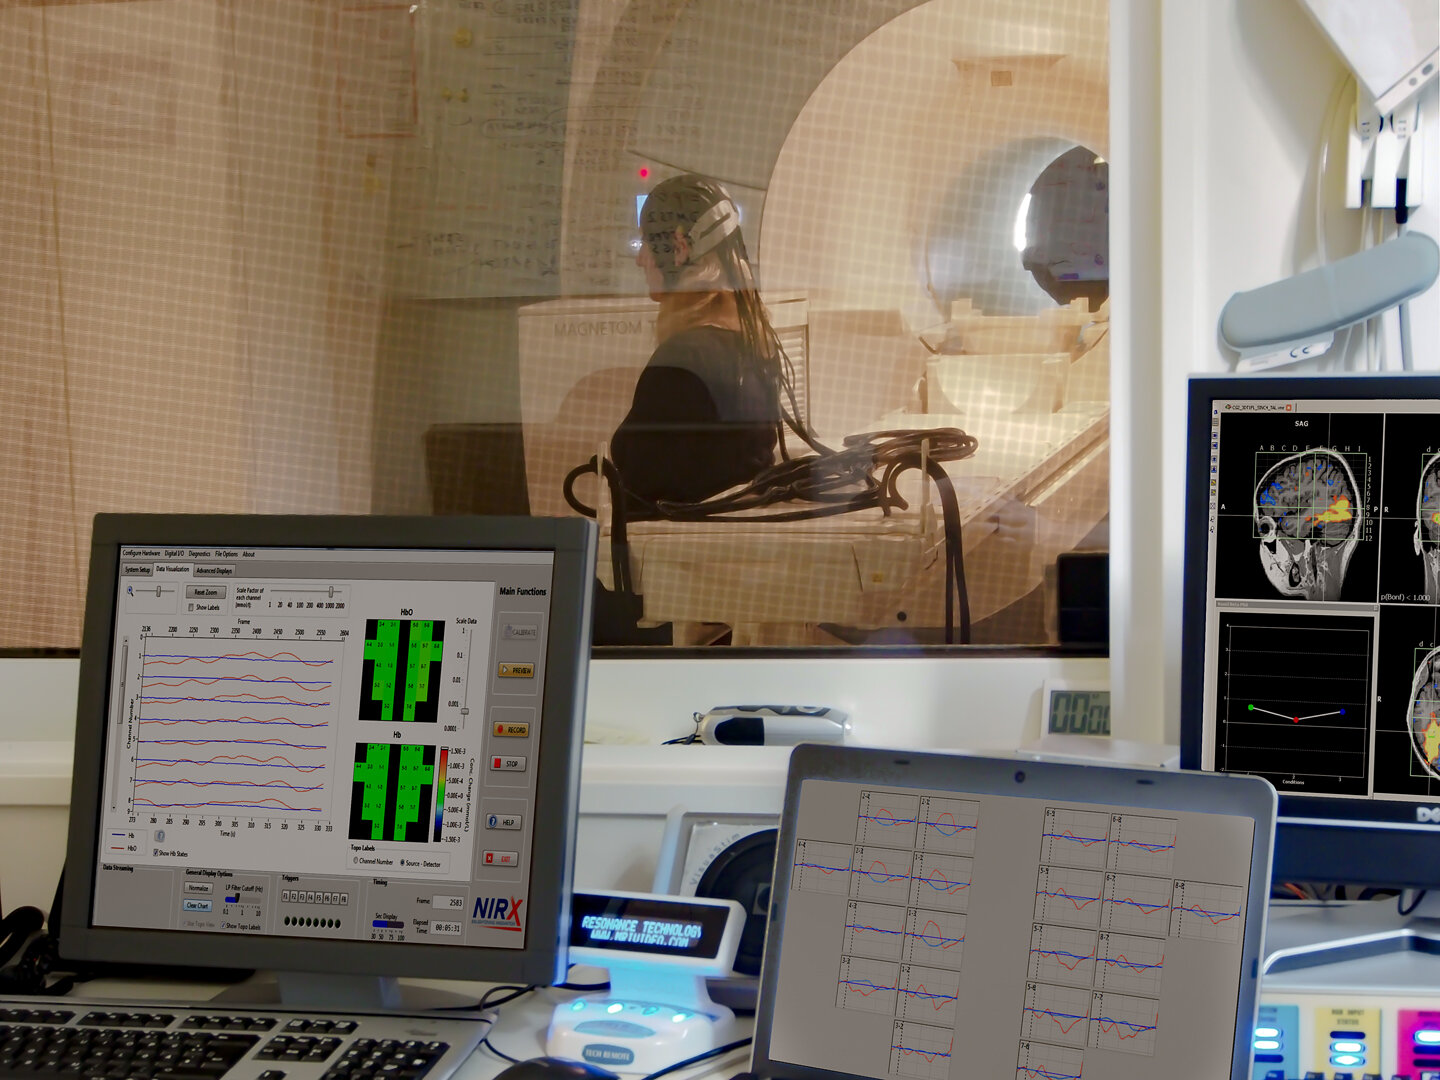
Example of concurrent fMRI and fNIRS imaging during a left and right finger tapping experiment. Left>Right (blue) and Right>Left (red)
SPM{t} activation images, contrasts defined in each image, overlayed on MNI template.
Comparing fNIRS hemodynamics to fMRI hemodynamics
It is therefore of interest to many researchers how fNIRS compares to fMRI in studies of brain function. While concurrent fMRI and fNIRS measurements have been mostly aiming at validating fNIRS as a newer technology or studying the spatial and temporal correlations between the fMRI BOLD signal and the concentration changes in oxygenated and deoxygenated hemoglobin, it is evident that combined fNIRS and fMRI can give new insights into brain function by overcoming some of either modlities intrinsic limitations.

The optical nature of the fNIRS signal, its robustness to motion, its relatively lower cost, as well as its small size and high level of portability, makes fNIRS an ideal candidate for multimodality studies. fNIRS can effortlessly be combined with fMRI, EEG, TMS, tDCS and many other imaging modalities, without causing any measurement interferences.
fNIRS-fMRI with NIRx systems
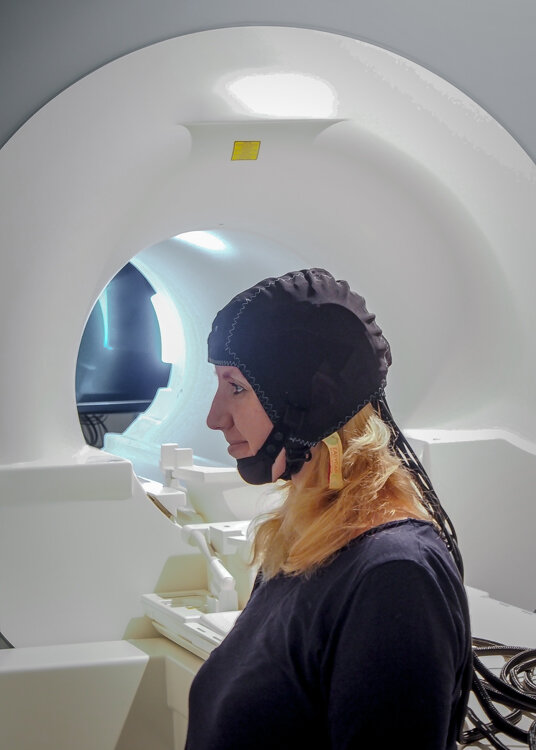
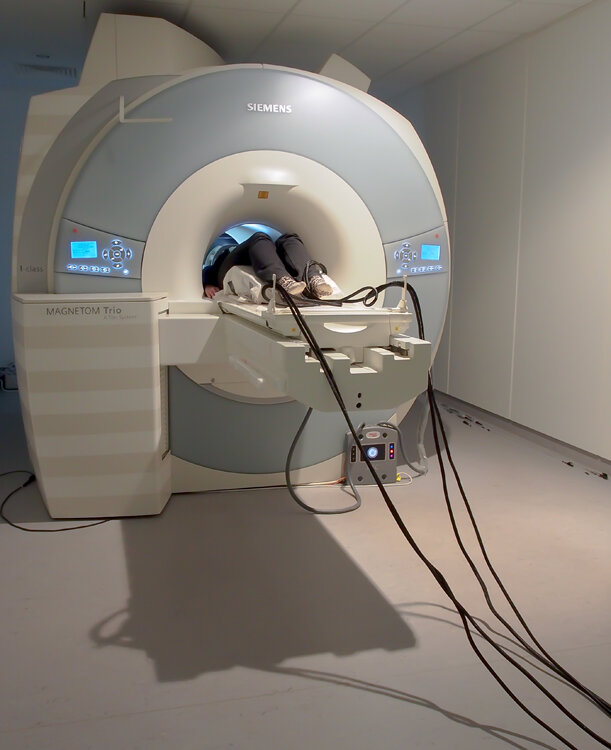
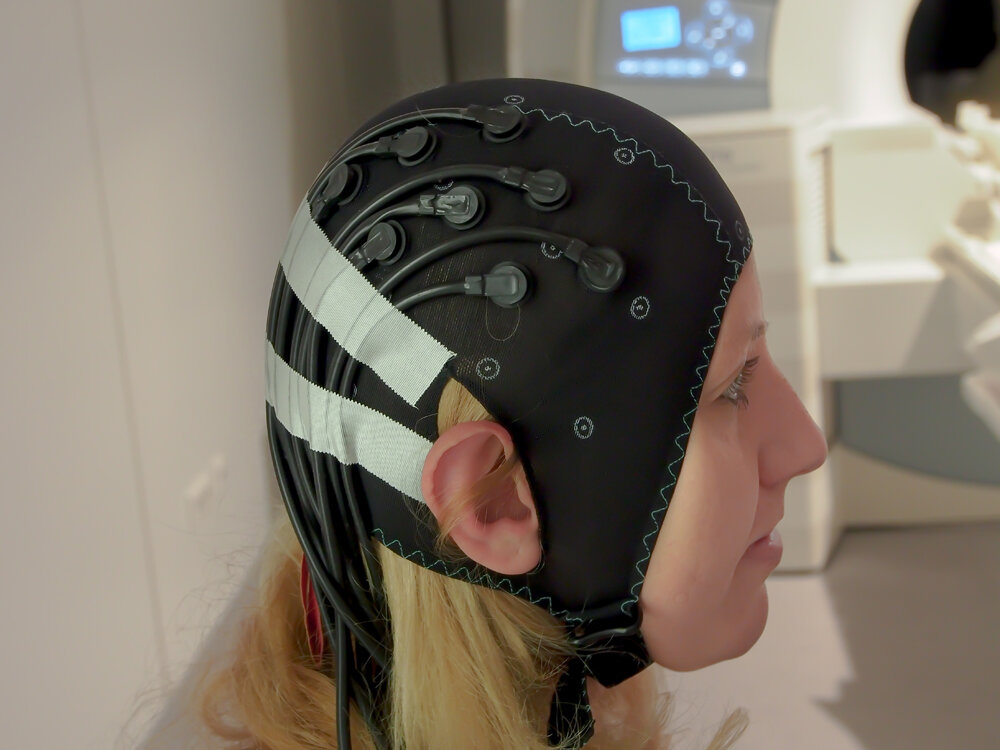
All NIRx NIRSport and NIRScout systems can be adapted with MRI compatible modules, including sufficiently long optical fibers and MRI compatible optodes, for seamless installation in an MRI environment. Digital trigger inputs also allow for fNIRS/fMRI integration. Thanks to the modular design of NIRx devices, the number of fNIRS sources and detectors can be customized based on the intended coverage.

Above: Statistical results of OT(top row) and fMRI (bottom row) using right and left finger tapping. Note that high activation is coded in blue (negative t-values) in the OT maps. The fMRI results show associated regions of the motor system (p<0.05, corrected).


